What we’re grading
Our scorecard evaluates public BI data reporting for all 50 states, as well as the District of Columbia and Puerto Rico. We assign states whole letter grades A through F; if states meet every criterion we have identified, they receive an A+. This letter grade solely reflects states’ alignment with BI reporting best practices and does not evaluate how well a state is responding to Covid-19 overall.
We break down best practices for reporting into two categories: data reporting, which addresses what states are sharing, and data presentation, addressing how they are sharing it. These criteria will be reviewed periodically to ensure they reflect the most pressing priorities for data on vaccine breakthrough infections—for example, we may begin tracking reporting of infections after vaccine “booster” doses. Here’s a summary of the criteria we are including in each category and why they are important. You can find details of how they are evaluated on the scorecard page.
Data Reporting
- Providing cumulative vaccine breakthrough cases, breakthrough hospitalizations, breakthrough deaths, and vaccinations: When a state can produce these cumulative counts, it indicates the data reporting systems it uses to produce vaccination status breakdowns are in good order.
- Providing cumulative percentages of Covid-19 cases, hospitalizations, and deaths among vaccinated and unvaccinated individuals: These percentages are important for public communication about the absolute and relative risk of Covid-19 infection, hospitalization, or death in vaccinated and unvaccinated populations.
- Providing time series of cases, hospitalizations, and deaths in vaccinated and unvaccinated people: Case, hospitalization, and deaths data by vaccination status over time are perhaps the most important breakthrough data for both public and policymakers alike—they allow for tracking absolute and relative changes in the incidence and severity of breakthrough Covid-19 infections. As with cumulative data, states can report time series data either as raw numbers of outcomes in vaccinated/unvaccinated population and the number of people in that population, or as rates dividing those two numbers. But rates can be calculated in many different ways, so without access to underlying data, they can be impossible to replicate or interpret. For that reason, for a state to receive the highest possible score for a time series, states had to report both a rate and all underlying data that went into that rate (i.e. number vaccinated over time and number of breakthrough cases over time).
Data Presentation
- Providing definitions for vaccine breakthrough cases, breakthrough hospitalizations, breakthrough deaths, vaccinations, and rates: Not all states define their Covid-19 metrics the same way, so it is important for states to provide definitions of all metrics.
- Making downloadable data available: Providing downloadable data, for example, as comma-separated values (CSV), increases transparency and enables researchers to use it in their own analysis.
- Regularly reporting data: Because timely data is important for understanding trends, states that do not share data at least monthly automatically receive an F.
What we found
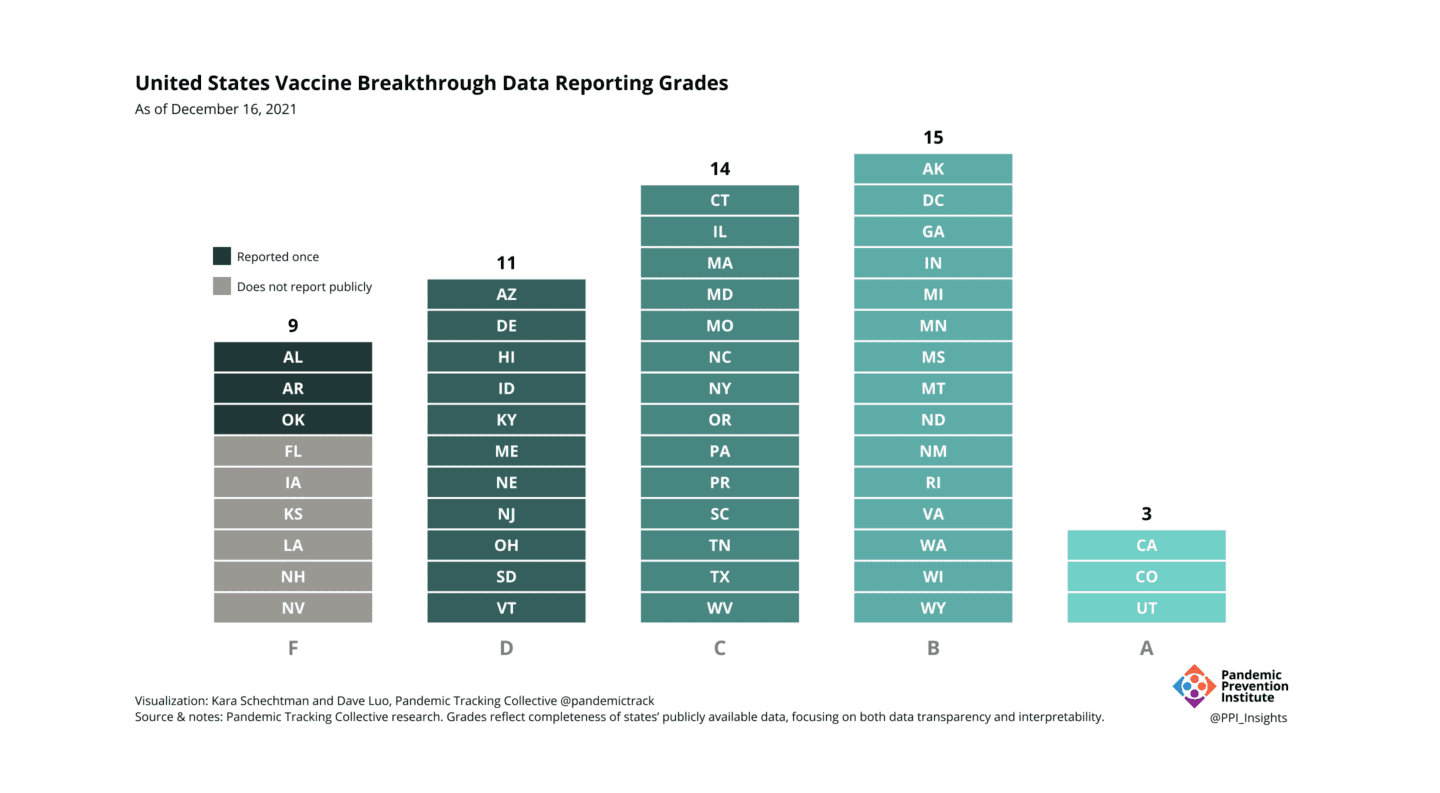
Figure 1: Currently, nine states receive an F grade because they do not share data regularly. Of the remaining states, three (California, Colorado, and Utah) meet the criteria for an A.
Our analysis of state reporting found that most states are now reporting breakthrough data—with 43 out of 52 jurisdictions now regularly sharing data, up from just over half that in the summer. Almost all of those states report important cumulative counts of cases, hospitalizations, and deaths; 34 of them report at least one metric over time.
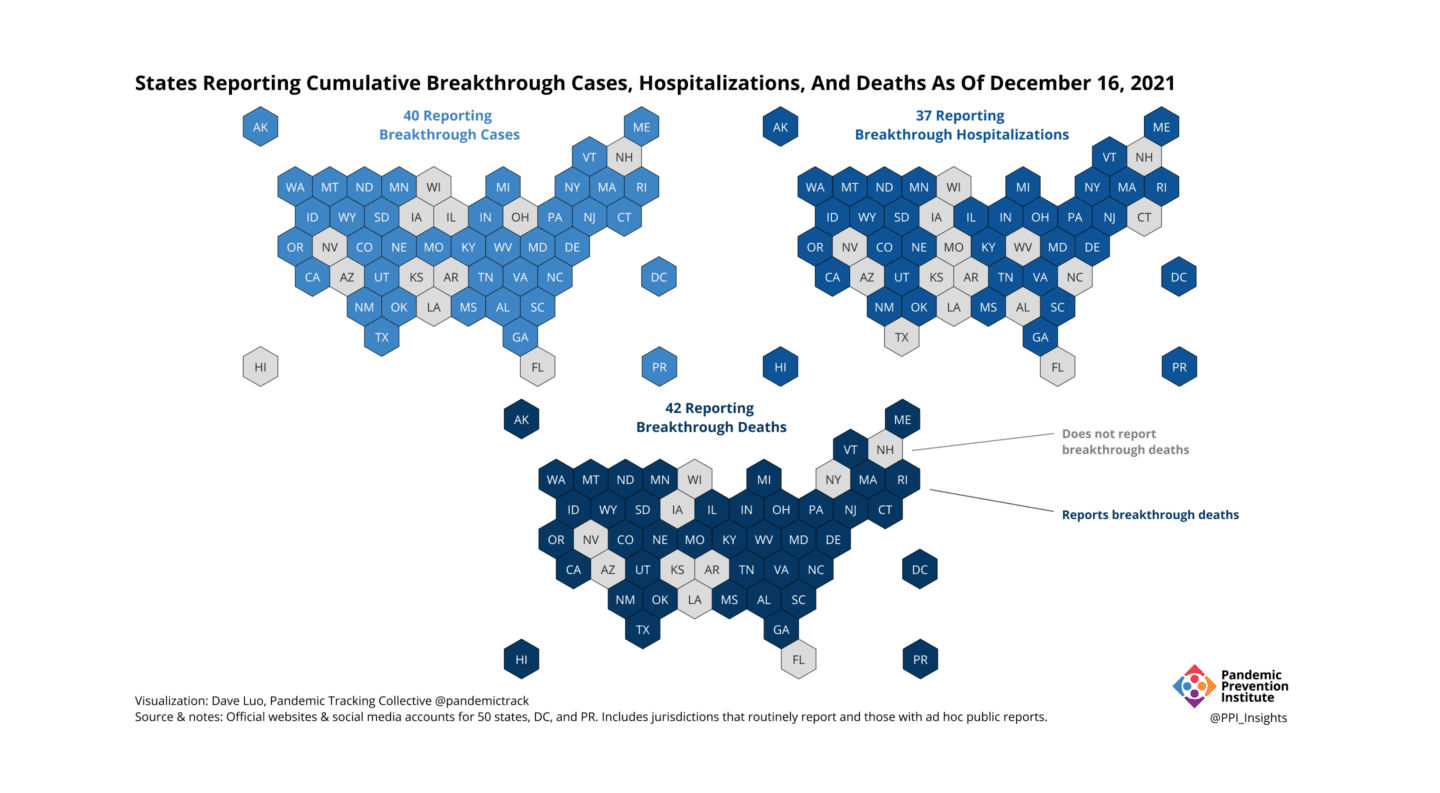
Figure 2: Including states with both regular and ad hoc public reports, as of December 16, 2021, 40 states have reported cumulative breakthrough cases, 37 states have reported cumulative breakthrough hospitalizations, and 42 states have reported cumulative breakthrough deaths.
The number of states that are reporting data is impressive given the uphill battle that state health departments have faced in collecting vaccine breakthrough data. Over the past decades, state health departments have been chronically underfunded, resulting in out-of-date, badly-maintained data systems for infectious disease surveillance. When we contacted states to confirm our assessments, some shared that they do not have resources to compile regular updates. To regularly capture, link, and publish these critical data, states need federal support, like that provided through the CDC’s Data Modernization Initiative or upcoming data infrastructure projects under the American Rescue Plan.
Even given infrastructure obstacles, an easy way many states could improve their grade is by making downloads available of all data underlying their time series—data they already use to calculate rates. While 34 states report at least one metric (i.e. incidence, hospitalization or mortality rates) by vaccination status over time, only three states make underlying data available for all reported rates, and only six states make any data downloadable. Currently, only three states meet the standard for an A [See Fig. 1]; if states made underlying data downloads available for all rates they are already reporting, 17 additional states would receive this grade.
Why it matters
Throughout our experience collecting Covid-19 data, we have repeatedly seen that providing consistent, interpretable, high quality data garners public trust. BI data shows a clear trend that Covid-19 hospitalization and deaths are largely concentrated in unvaccinated individuals. Sharing those data plays an important role in overcoming vaccine hesitancy.
Vaccine breakthrough data has other urgent policy implications: It provides crucial early warning signals for possible changes in transmission, vaccine-conferred immunity, and disease dynamics. To understand the risk that vaccinated individuals face from variants like Delta and Omicron—and to assess impact on vaccine effectiveness of any new variants that may emerge—we need access to timely and local vaccine breakthrough data that states can provide.
Working with limited resources, over the past two years, state health officials have accomplished remarkable feats to generate and share critical Covid-19 data with the public. We are optimistic that they will continue this exemplary public service by improving Covid-19 breakthrough data so that it is more transparent, standardized, and actionable.