The dashboard enables school districts to investigate questions such as:
- How does frequent routine testing impact in-person school attendance?
- What are the risks of testing less frequently or only doing symptomatic testing?
- How do risks and resources change by testing strategy (i.e. pooled polymerase chain reaction [PCR] testing, single-day antigen testing, or serial antigen testing on back-to-back days to improve accuracy)?

Here's how the dashboard works:
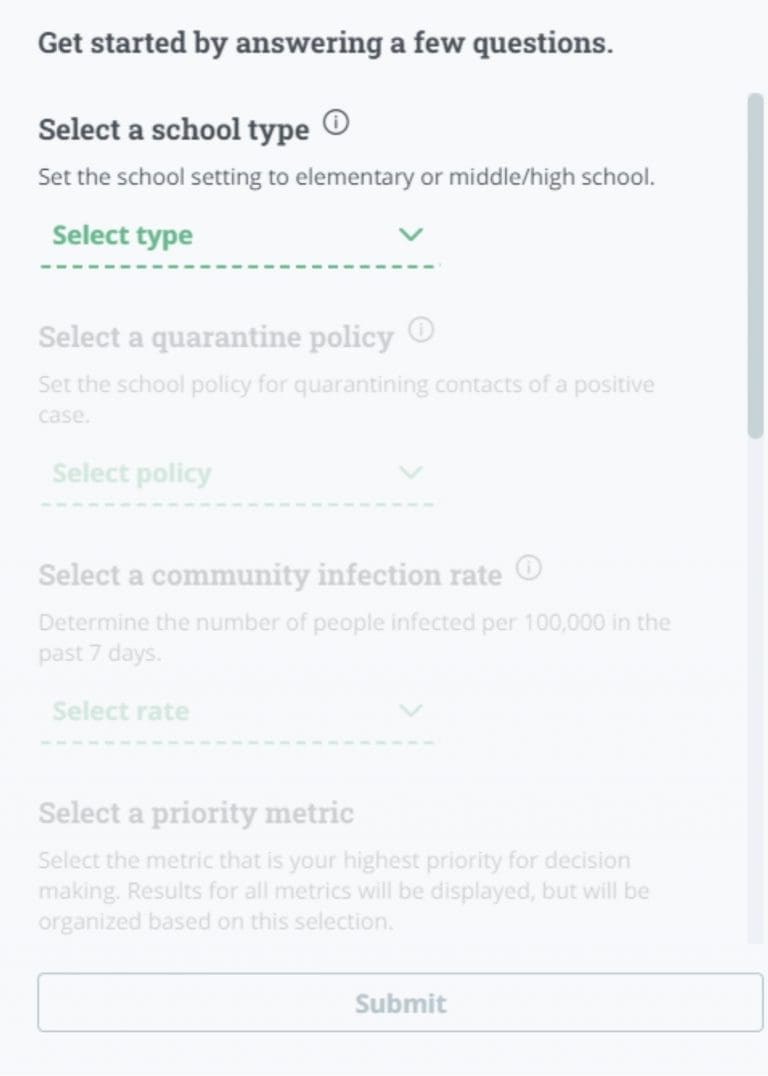
- Select key inputs such as school type (elementary or middle/high school), the community infection rate, and the school’s quarantine policy
- Select the priority goal, for example, do you want to reduce total in-school infections? Reduce the proportion of infections due to within-school transmission? Maximize the days of school attended? Estimate the number of tests needed? Maximize the proportion of infections found through routine testing?
- Select the populations you want to test, the testing types, and the frequency
- Compare the potential impact of your selected testing approaches on your priority goal and on other outcomes
This dashboard builds on the work of a recent study from Mathematica, supported by The Rockefeller Foundation, and makes the full range of results accessible to users. Our findings, based on agent-based modeling, showed that regular COVID-19 testing in primary and secondary schools can help keep schools safe. For example, weekly pooled PCR testing of all students, teachers, and staff can reduce total infections in students and staff by an estimated 10−19 percent.[1] However, this strategy is also associated with a 1−12 percent reduction in in-person school days, once isolation and quarantining are considered.
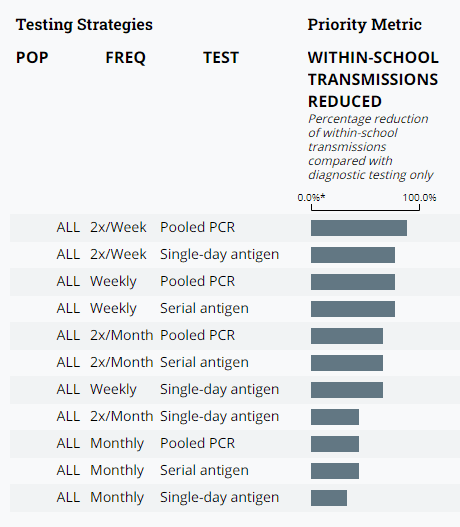
While we found that most strategies have only a modest impact on the total number of infections in a school, our model allows us to address another question we are rarely able to answer in the real world, given contact-tracing limitations: what percentage of in-school infections come from transmission happening within the school, as opposed to coming in from the community? In most cases, school administrators need to make decisions based only on the total number of infections they see in their schools. Modelling allows us to estimate the percentage of infections that result from within-school transmission, an important indicator of whether a testing strategy is helping keep a school safe. We found that routine testing strategies, especially serial antigen and pooled PCR testing, can reduce within-school transmission. For example, testing in a high school that quarantines close contacts in a community experiencing 50 cases per 100,000 reduces within-school transmission by 33−89 percent.
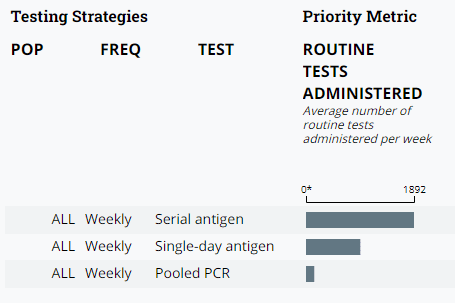
In addition to considering the health and well-being of their populations, school districts must also weigh the costs of any routine testing strategy. Pooled PCR and serial antigen testing strategies are similarly effective at reducing within-school transmission, but the number of tests required for each strategy varies greatly (for example, serial antigen testing requires two tests for every person tested, while pooled PCR testing can test people in groups with a single test). For example, in the same high school described above, the number of tests across weekly testing strategies varies between 144 and 1892 tests per week.
As new funding and technical assistance break down we hope this dashboard equips schools with the data they need to determine which testing strategy is right for them.
We welcome questions or feedback on our dashboard. Please email us at jhotchkiss@mathematica-mpr.com or dvohra@mathematica-mpr.com.
[1] In recent months, more schools have refined their testing approaches and we have learned more about test performance, allowing us to update some of our original model assumptions. Therefore, the results shown in the dashboard differ from those in our original report.
Related Updates

Interactive Dashboard Visualizes Covid-19 Testing Scenarios for Education Leaders
As we continue to make progress in the fight against Covid-19, more and more schools are making in-person learning an option for their students. Mathematica, The Rockefeller Foundation, and the Duke Margolis Health Policy Center partnered to create an interactive online dashboard that allows users to explore the benefits and drawbacks of routine testing in […]
More